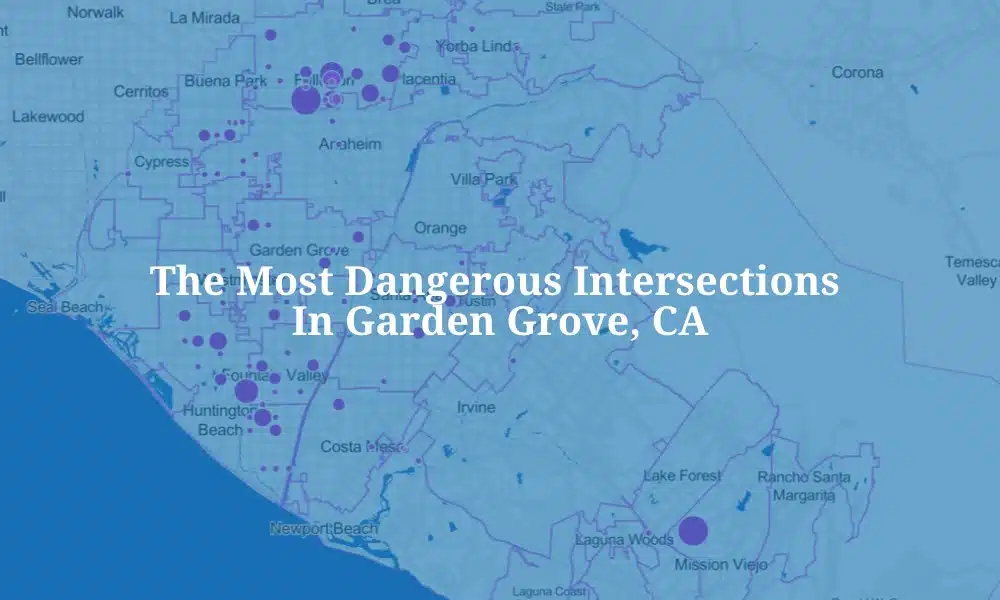
The Most Dangerous Intersections in Garden Grove
July 29, 2020
From 2010 – 2018, the city of Garden Grove was home to nearly 4,000 intersection related motor vehicle crashes. These crashes resulted in over 2,500 injuries and 18 deaths.
Where are Garden Grove motorists at the highest risk of collision and injury?
As part of a larger study, Aitken Aitken and Cohn identified the 25 most dangerous intersections in Garden Grove, CA based on collision and injury volume.
* Intersections are ranked according to their Crash Risk Index (CRI) score. CRI is a composite score that takes the crash count and the volume and severity of injuries into account.
| Rank | OC Rank | Road 1 | Road 2 | Crashes | Fatalities | Total Injuries | CRI |
|---|---|---|---|---|---|---|---|
| 1 | 11 | Haster St | Lampson Av | 48 | 2 | 36 | 100.5 |
| 2 | 23 | Chapman Av | Magnolia St | 45 | 0 | 39 | 87 |
| 3 | 25 | Newhope St | Trask Av | 48 | 0 | 44 | 87 |
| 4 | 64 | Garden Grove Bl | West St | 39 | 0 | 37 | 70.5 |
| 5 | 87 | Clinton St | Westminster Av | 29 | 0 | 27 | 64.5 |
| 6 | 97 | Chapman Av | Gilbert St | 29 | 1 | 23 | 61.5 |
| 7 | 102 | Brookhurst St | Chapman Av | 32 | 1 | 21 | 60.75 |
| 8 | 109 | Lampson Av | Magnolia St | 33 | 0 | 23 | 60 |
| 9 | 111 | Dale St | Garden Grove Bl | 28 | 0 | 29 | 59.25 |
| 10 | 116 | Chapman Av | Euclid St | 32 | 0 | 28 | 58.5 |
| 11 | 130 | Bushard St | Westminster Av | 30 | 0 | 26 | 57 |
| 12 | 148 | Brookhurst St | Westminster Av | 41 | 0 | 20 | 54.75 |
| 13 | 155 | Harbor Bl | Trask Av | 46 | 0 | 19 | 54.75 |
| 14 | 162 | Chapman Av | West St | 28 | 0 | 24 | 54 |
| 15 | 178 | Chapman Av | Knott St | 26 | 0 | 26 | 52.5 |
| 16 | 184 | Harbor Bl | Lampson Av | 33 | 0 | 24 | 51.75 |
| 17 | 187 | Magnolia St | Orangewood Av | 30 | 0 | 29 | 51.75 |
| 18 | 204 | 9Th St | Garden Grove Bl | 33 | 0 | 26 | 50.25 |
| 19 | 212 | 9Th St | Chapman Av | 29 | 0 | 25 | 49.5 |
| 20 | 218 | Garden Grove Bl | Newland St | 27 | 0 | 17 | 48 |
| 21 | 228 | Garden Grove Bl | Harbor Bl | 37 | 0 | 18 | 47.25 |
| 22 | 244 | Chapman Av | Springdale St | 22 | 0 | 25 | 45.75 |
| 23 | 275 | Kerry St | Westminster Av | 21 | 1 | 18 | 42.75 |
| 24 | 288 | Brookhurst St | Garden Grove Bl | 26 | 1 | 14 | 42 |
| 25 | 307 | Brookhurst St | Lampson Av | 21 | 0 | 24 | 41.25 |
While only three Garden Grove intersections made our top 50 in the county, all 25 five intersections here saw over 20 crashes.
Haster and Lampson is far and away the most dangerous intersection in Garden Grove. It is also the only crossing in the top 25 that saw more than one fatality during the study period.
Data and Methodology
Our full study has more information on data sources, methodology and what you can do to remain safe on the road.
If you would like to republish or share the results of our study, please provide Aitken Aitken & Cohn with attribution by linking to this page.