The Most Dangerous Intersections in Huntington Beach
July 30, 2020
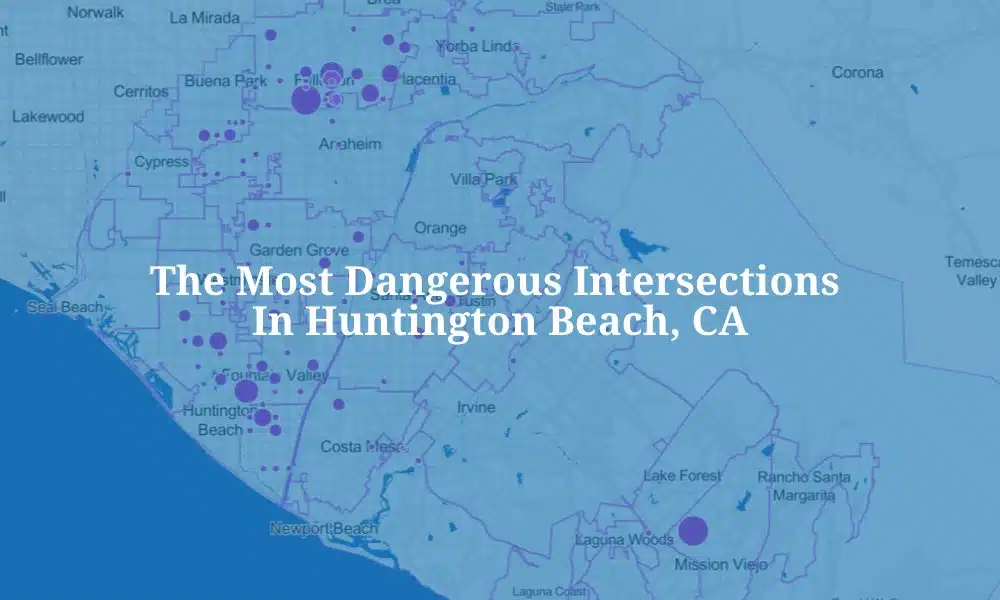
From 2010 – 2018, there were 4,053 crashes at intersections in Huntington Beach. More than 4,600 people were injured and 31 people were killed as a result of these collisions.
At Aitken Aitken & Cohen, we wanted to find out which Huntington Beach crossings put motorists at higher risk of collision and injury.
As part of our broader study of intersection-related collisions in Orange County, we found that three of the most dangerous intersections in Orange County are located in Huntington Beach.
We analyzed nine years of collision data and calculated a Crash Risk Index (CRI) for each crossing based on collision volume and injury severity.
In addition to providing a list for all of Orange County, we identified Huntington Beach’s most dangerous intersections. Below are the results of our analysis.
The 25 Most Dangerous Intersections in Huntington Beach
| Rank | OC Rank | Road 1 | Road 2 | Crashes | Fatalities | Total Injuries | CRI |
|---|---|---|---|---|---|---|---|
| 1 | 4 | Ellis | Newland | 42 | 0 | 72 | 124.5 |
| 2 | 8 | Gothard | Heil | 47 | 0 | 58 | 110.25 |
| 3 | 9 | Magnolia | Yorktown | 33 | 0 | 56 | 108.75 |
| 4 | 13 | Adams | Bushard | 32 | 1 | 49 | 98.25 |
| 5 | 24 | Mcfadden | Springdale | 39 | 0 | 51 | 87 |
| 6 | 27 | Gothard | Talbert | 38 | 0 | 48 | 85.5 |
| 7 | 30 | Edwards | Heil | 28 | 0 | 44 | 84 |
| 8 | 34 | Garfield | Magnolia | 26 | 0 | 46 | 81 |
| 9 | 35 | Brookhurst | Hamilton | 29 | 0 | 51 | 81 |
| 10 | 36 | Newland | Slater | 38 | 0 | 50 | 81 |
| 11 | 43 | Newland | Yorktown | 24 | 0 | 34 | 76.5 |
| 12 | 47 | Bushard | Hamilton | 27 | 0 | 39 | 75 |
| 13 | 48 | Bushard | Yorktown | 25 | 0 | 44 | 74.25 |
| 14 | 52 | Hamilton | Magnolia | 24 | 0 | 39 | 72.75 |
| 15 | 59 | Adams | Newland | 24 | 0 | 42 | 72 |
| 16 | 66 | Gothard | Warner | 32 | 0 | 37 | 69.75 |
| 17 | 77 | Edwards | Slater | 30 | 0 | 39 | 66.75 |
| 18 | 89 | Heil | Springdale | 29 | 0 | 37 | 64.5 |
| 19 | 124 | Edinger | Graham | 25 | 0 | 30 | 57.75 |
| 20 | 129 | Graham | Warner | 18 | 0 | 34 | 57 |
| 21 | 142 | Slater | Springdale | 20 | 0 | 32 | 55.5 |
| 22 | 152 | Atlanta | Magnolia | 22 | 0 | 33 | 54.75 |
| 23 | 165 | Edinger | Springdale | 19 | 1 | 24 | 53.25 |
| 24 | 172 | Main | Yorktown | 16 | 1 | 20 | 52.5 |
| 25 | 179 | Edwards | Garfield | 14 | 1 | 25 | 51.75 |
*Rankings were determined by each intersections CRI, which weighs the number of crashes against the number and severity of injuries.
The most dangerous intersection in Huntington Beach (and the 4th most dangerous in all of Orange County) is Ellis & Newland.
This intersection was associated with more injuries from motor vehicle collisions than any other crossing in Huntington Beach – only two other intersections in the county had more.
As previously mentioned, three of the top ten intersections in the County were found in Huntington Beach – Ellis & Newland, Gothard & Heil, and Magnolia & Yorktown. In fact, Huntington Beach had 13 of the top 50 intersections overall, second only to Fullerton’s 18.
This is despite the city having several thousand fewer crashes (4,053) and injuries (4,613) than Anaheim (6,457 crashes and 7,908 injuries) or Santa Ana (6,086 crashes and 7,161 injuries).
The most dangerous intersection in Huntington Beach (and the 4th most dangerous in all of Orange County) is Ellis & Newland. This intersection was associated with more injuries from motor vehicle collisions than any other crossing in Huntington Beach – only two other intersections in the county had more.
Data, Methodology and Fair Use
If you would like more information on the data sources used or the methodology of our study, please see our main study page.
If you would like to republish or share the results of our study, please provide attribution to Aitken Aitken & Cohen by linking to this page.